The US stock market surged to yet another record high on Thursday, a new milestone that suggests a rising tide is lifting all equity sectors. Yet reviewing the market through a risk-factor risk lens tells a more nuanced story, revealing a wide dispersion of trends that have emerged since the conflict with Iran began on Feb. 28, based on a set of ETFs through yesterday’s close (May 14).
The results suggest that much of the difference between equity-portfolio strategies during the war-regime period can be traced to factor allocations. For example, among the winning strategies of late there’s a good chance that the portfolios have relatively high allocations to the momentum factor, intentionally or otherwise.
The momentum factor is the clear leader, outperforming the rest of the field by a wide margin. The iShares MSCI USA Momentum Factor ETF (MTUM) has surged 21.6% since the attack started nearly three months ago. The next-strongest performer is large-cap growth (IWV) with a 16.3% rally. Both funds are posting sharply higher gains vs. the market benchmark via SPDR S&P 500 ETF (SPY), which is up 9.4% since Feb. 28.
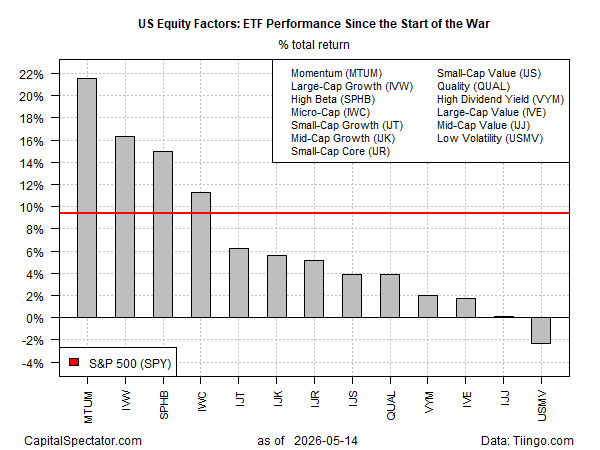
Most equity factors are trailing the broad market (SPY), including one downside outlier. The low-volatility factor has delivered especially poor results since the start of the conflict, which has shifted to a precarious stalemate that continues to block energy exports from the Gulf. The iShares MSCI Minimum Volatility ETF (USMV) has lost 2.3% since Feb. 28.
Despite the headline strength in equities, the widening gap between factor winners and laggards underscores how uneven the market’s internal dynamics have become. Momentum’s dominance and low volatility’s slump suggest investors are rewarding exposure to persistent trends while shunning defensive positioning, even as geopolitical risk remains elevated. That divergence is a reminder that record highs can mask shifting fault lines beneath the surface—fault lines that may matter far more if the current geopolitical stalemate breaks in either direction.
Learn To Use R For Portfolio Analysis
Quantitative Investment Portfolio Analytics In R:
An Introduction To R For Modeling Portfolio Risk and Return
By James Picerno