The stock market’s calmer, but the jury’s still out on what the mortgage mayhem means for the economy. So far, however, there’s scant sign of trouble in the numbers.
Yesterday’s report on initial jobless claims, for instance, offered more of the same of late, which is to say that a middling performance remains the status quo. For the week through August 18, new filings for unemployment insurance actually slipped by 2,000 to 322,000, which is virtually unchanged from a year ago. There may be great drama unfolding in the capital markets, but yawns still dominate analysis of employment’s leading indicators.
Of course, this may be the calm before the storm for the economy. Morgan Stanley’s chief U.S. economist, Richard Berner, told The Wall Street Journal in a story published today that economic trouble is brewing, even if it’s not yet obvious. He predicted that “the housing downturn is going to be more prolonged and deeper than people might have imagined.”
Author Archives: James Picerno
WATCHING, WAITING & NIBBLING
It’s probably too soon to decide if the market tsunami has past or is just taking a breather. But it’s not too soon to start assessing the damage among the major asset classes.
As always, such surveys are a mix of looking at the past but with the hope of finding clues about what’s coming. Indeed, future returns are minted from events in the present. Of course, recognizing that is only the first step in a long strategy journey, which is why we keep turning over rocks wherever we find them. Most of the time the effort’s for naught. But if there’s ever a chance to mine intelligence about prospective returns, the opportunity may be highest directly following periods of extreme stress in the capital markets.
That’s just another way of saying that in the rare cases when prices and valuations move to excess, the actions modestly elevate the clarity about future returns and risks. Or so history suggests.
With that in mind, how have the major asset classes fared in recent weeks? As our table below suggests, the answer can be summarized by the central principle of the capital asset pricing model: risk matters. Higher risk has been a costly attribute in recent weeks. Cash, a realm where risk is minimal, was the best performer in the past four weeks. In contrast, asset classes with higher risks have lived up to their profile by dispensing higher losses.
High returns are the other facet at times of high risk, as the past five years remind. But the tables have turned this summer, although that’s hardly an extraordinary or unexpected change for anyone who understands the CAPM-inspired notions of risk and reward.
ONE PHOTO’S WORTH A THOUSAND QUESTIONS
The photo op didn’t help.
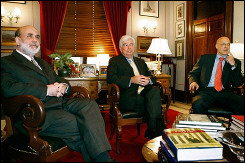
Bernanke meeting yesterday with Sen. Dodd and Treasury Secretary Paulson
There’s much debate about how to proceed on monetary policy, but on at least one basic point there can be no argument: history clearly shows that central banks must be independent if they’re to be effective stewards of a nation’s currency. Simply put, the political factor has no place in central banking. Yes, it leaks in from time to time, but every effort should be made to keep it at arm’s length. The issue is more than window dressing. A large body of evidence shows that central banking works better when the political influence is reduced, ideally to zero.
With that in mind, a central bank’s independence flows from two fonts of power and influence. Ultimately, one is at risk when the other’s threatened, or is perceived to be threatened. The first is the fundamental autonomy that’s driven by the opportunity to weigh decisions based solely on the economics, i.e., monetary decisions that are unbound from the political aura that otherwise informs government action. The second source of a central bank’s authority and efficacy is what one might call soft power: the ability to shape perceptions in the market by tools other than the hard power of changing interest rates, adjusting money supply, etc. Giving speeches, for instance. Soft power draws heavily on the prevailing pool of respect for the central bank and a belief in its integrity for effecting change based on the economic merits. And the market’s belief in that integrity relies in no small part on the assumption that the Fed’s impervious to the political winds du jour.
CLUESS IN EQUITIES?
Relative tranquility returned to equity trading yesterday. The S&P 500 moved within a fairly tight range on Monday relative to recent history and closed down by only a small fraction vs. Friday. That’s progress next to last week’s turmoil: yesterday’s session was calm, cool and…clueless.
Clueless? Yes, if you were judging sentiment by what unfolded in the credit markets yesterday. In particular, a heightened state of fear gripped trading on the short end of the maturity spectrum. With a growing penchant to kick anything of less-than-stellar credit quality, investors rushed to safety by purchasing Treasury bills, the ultimate zone of security among paper assets. In the process, commercial paper of questionable quality took it on the chin.
The net result: the 3-month T-bill yield fell to around 3.12%, down from 3.76% on Friday’s close according to U.S. Treasury numbers. The commensurate rise in the price of a 3-month T-bill yesterday (bond prices move inversely to yields) has been widely reported as the biggest since the 1987 stock market crash. Even more striking is the fact that as recently as late July, 3-month T-bills yielded more than 5%.
CHOOSE WISELY
Take your pick: inflation or recession. Or, if your outlook is especially surly, perhaps you’ll opt for choice three: a bit of both, otherwise known as stagflation.
We’re not sure which one will prevail and, unfortunately, neither does the central bank. If pressed, our prediction is one of modestly slower growth, which might take the edge off inflation without derailing the economy. The lesser of several evils, if you will. But is that just wishful thinking? Who knows? In times like these, when well-founded assumptions about the morrow fold like cheap cameras, one has to take predictions with an increasingly skeptical mindset. And why not? That’s the nature of the future: it’s unknown, leaving investors, central banks, butchers and bakers with the unpleasant task of guessing, or forecasting, as it’s called in civilized conversations.
But no matter what you call it, the Federal Reserve has no choice but to indulge in it, for better or worse. Even under the best of circumstances, divining the future so as to reverse engineer an informed monetary policy today is a job with more than a trivial dose of risk. With disinflationary winds blowing hard in recent years, the job has looked easy in hindsight. But the jig is up and a far more complicated and risky climate has imposed itself on the business of central banking. Volatility has returned with gale force winds in some corners of the capital markets. The Fed has only a supply of blunt weaponry to battle the storm, but one makes due with the arsenal at hand.
VOLATILE OPPORTUNITIES
These are the times that try investors’ souls, pinch their wallets and raise questions about what constitutes sound thinking on investment strategy.
No, we don’t have definitive answers, but we can at least take a stab at dispensing some perspective, albeit informed by limited information that afflicts the mortal senses. With that caveat out of the way, perspective starts with the fact that volatility, as much as it scares us, is a good thing for strategic-minded investors. And the market has been nothing of late if not volatile.
The VIX index, a measure of S&P 500’s price volatility, has taken wing in recent weeks, effectively tripling from its close at the end of last year, as the chart below illustrates. Dramatic as the new trend is, the resurrection of risk isn’t all that surprising.
This past January we asked: Is Volatility Set for a Comeback? At the time, pondering a future of revived risk was widely dismissed as misguided ramblings. The bulls, you may recall, were then basking in a rare state of total control over asset classes. Everything had been rising for five years or more, and in the process price volatility fell sharply. The markets, in short, were priced for perfection, as they say. The fact that the perfection came after five years of fun suggested that it was time to prepare for something else. The timing and catalyst that would usher in change were still mysteries in January 2007. But the future seemed clear for those who believed that risk can’t stumble and stay abnormally low forever.
ANOTHER DISCOURAGING REAL ESTATE REPORT
A number of dismal scientists and market strategists have been advising for some time that the real estate market was set to stabilize. It wasn’t poised to grow necessarily, but that was just fine as far as the broader economy was concerned. The prediction fit nicely with the idea that if real estate simply stopped being a drag on the GDP calculation, the second half of 2007 into early 2008 would look pretty good in terms of growth.
That may yet prove accurate. But after reading this morning’s news on housing starts for July, new doubts arise about the momentum of real estate’s correction and, by extension, GDP’s prospects in the second half.
The Census Bureau reported today that housing starts dropped again last month, falling 6% from June, on a seasonally adjusted annualized basis. More dramatically, July’s 1.381 million annualized starts are down 21% from a year ago, as our chart below shows. Permits issued for new private housing construction is also off sharply on a monthly and annual basis through July.
The housing starts and permits trends suggest that the pain continues. Until and if the numbers show some stability, there’s reason to expect more of the same, namely, declines. That may or may not be the right thing to do, but short of knowing the future, what else can a prudent investor to do these days?
CPI VS. GLOBAL LIQUIDITY
Today’s report on July consumer prices gives the Federal Reserve a bit more elbow room for lowering rates. This alone doesn’t insure a rate cut’s imminent, but at least one can reason that the CPI news alone doesn’t preclude the central bank from unleashing a fresh round of monetary easing.
The Labor Department reported that seasonally adjusted headline CPI rose by a mere 0.1% last month. For the year to July, CPI climbed by just 2.4%, the slowest annual pace since February.
Core CPI also looks contained. On an annual basis, CPI ex-food and energy advanced 2.2% for the year through July, unchanged from the annual rate posted in June.
On its face, the CPI news comes just in time to counter yesterday’s whiff of trouble embedded in the report on producer prices. As we wrote yesterday, there was reason to worry that core PPI was starting to look robust once more. But with no corroborating evidence in today’s CPI, one can breathe a sigh of relief. Taken together, PPI and CPI offer a mostly encouraging review about general price trends.
But for those who look beyond inflation measures proper, there are still gads of liquidity in the global economy. This despite the recent liquidity crunch roiling the mortgage market at the moment. The question for strategic-minded investors is whether to take the CPI report as gospel and dismiss the still-robust growth in liquidity in countries near and far. Alternatively, is there reason to fear that global liquidity presents a threat for the Fed and its mandate to keep inflation contained? If so, does that mean that Bernanke and company have less room to ease rates than the CPI report alone suggests?
THE NEW PROBLEM WITH CORE PPI
This morning’s update on wholesale prices brings news that inflation may not be going quietly into the sunset just yet.
Producer prices rose 0.6% last month, up sharply from the 0.2% decline in June, the Bureau of Labor Statistics reported today. But that’s a straw man. Energy was the culprit, courtesy of July’s sharp rise in crude oil–a rise that’s since pulled back.
It’ll be tougher explaining away the rising trend in core PPI, however. As our chart below illustrates, PPI excluding food and energy continues bubbling higher on a rolling 12-month basis. For the year through July, core PPI jumped 2.4%, the highest pace in nearly two years.
The optimistic view is that the surge in 12-month core CPI is due to “technical reasons”–the falling off of a negative number in the rolling calculation. In other words, the -0.5% for July 2005 drops out of the latest update for the last 12 months, replaced by 0.4% for August 2005. Meanwhile, last month’s core PPI was just 0.1%, down from 0.3% in June. Of course, it’s the longer-term trend that ultimately matters rather than the number from a given month. As such, the above chart is what it is. Perhaps next month will provide evidence that the current 12-month surge was a one-time event; perhaps not.
Meanwhile, the trend as it currently stands seemed to have caught the attention of traders in Fed funds futures. A number of contracts dropped sharply in price in early trading this morning after the PPI news, suggesting that the prospects for a rate cut may have dimmed, at least for the moment.
ANXIOUS & CLUELESS
The only thing worse than a financial crisis is a financial crisis that hits when the economy’s in or near recession. Fortunately, the economy’s still growing, and for the moment there’s no reason to think the expansion is in imminent danger of evaporating.
The latest evidence comes in this morning’s July report of retail sales, which rose 0.3% last month, reversing June’s nasty 0.7% tumble, the U.S. Census Bureau reported today. For the year through July, retail sales climbed 3.2%.
On its face, the numbers suggest, albeit modestly, that the growth machine remains intact. But the worries start to set in when you consider the historical context, which we’ve laid out for retail sales in the following chart.
It’s clear that when retail sales are viewed through the prism of recent history, there’s reason to wonder if Joe Sixpack can continue to spend at yesterday’s levels tomorrow. Graphically, the rate of retail sales growth is slowing–on that there’s no debate, as the linear progression trend (the blue line) indicates. Adding to the potency of the trend is the fact that the latest reading is well the trend line, not to mention near the absolute low of late set back in January and about half as much as the latest reading for the nominal rate of annualized GDP growth. All of which raises a few questions: Are retail sales unusually low for the current economic climate? Or is the pace of economic expansion too high given the trend in retail sales?