Skill is a slippery concept in finance, courtesy of the shady influence of chance in asset pricing. It’s also an awkward topic in just about every corner of money management because discussing it in detail invariably raises serious doubts about our ability to engineer investment results that are satisfactory much less stellar. But ignored or not, randomness is a factor and perhaps a far more powerful one than generally assumed.
In recent posts I’ve explored several facets of how random market behavior can influence portfolio results. In the first installment on the topic we focused on random rebalancing dates. Then we moved on to the results via randomly changing asset weights in asset allocation. Let’s push this testing a step further and build portfolios by randomly selecting asset classes.
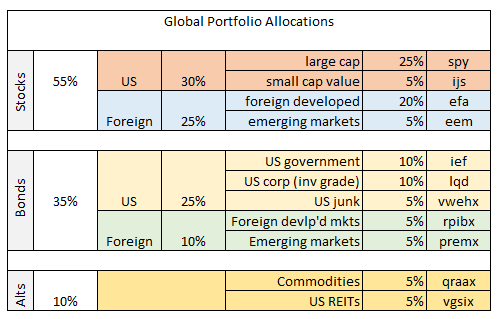
As before, I’ll use the same 11-fund portfolio that’s globally diversified across key asset classes with a starting date of Dec. 31, 2003. The benchmark strategy is rebalancing the portfolio at the end of each year back to the initial weights, as defined in the table below. Let’s call this our “reasonable” attempt at building an informed asset allocation strategy.
For comparison with the element of chance in market pricing, this time the test consists of randomly selecting combinations of asset classes with equal weighting that rebalances the mix back to equal weights every Dec. 31. Note that there are 11 funds in the table above. To test for randomness I’ll use R’s number-crunching prowess to select 1,000 different asset allocation mixes. For instance, one randomly selected portfolio may hold US stocks, US REITs, and commodities and ignore everything else. Another portfolio may hold everything with the lone exception of US junk bonds. (For those who’re interested in the details, I’m selecting time series data via the sample() command with no replacement.) All random portfolios are created as equal weight strategies (if there’s more than one fund) using a start date of Dec. 31, 2003, with results running through yesterday’s close (Apr. 6).
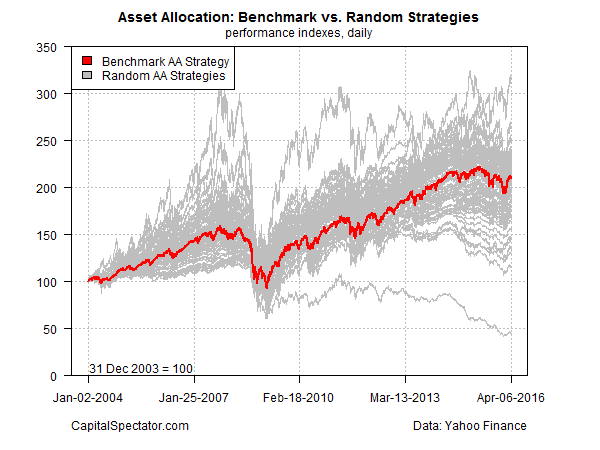
The chart below compares the benchmark portfolio (red line) with 1,000 random portfolios as defined above. As you can see, there’s a wide range of outcomes relative to the benchmark portfolio, which increased from 100 to roughly 211 over the test period–i.e., the portfolio more than doubled. By contrast, the best-performing random portfolio surged to more than 300 while the worst performer collapsed to just under 50. Most of the random portfolios, however, dispensed moderately superior or inferior results relative to the benchmark.
Let’s review the same data from another perspective by comparing the ending value of the benchmark portfolio (red line) for the sample period with the distribution of ending values for the 1,000 randomly generated strategies (black line). Note that the median outcome for the random portfolios is also included in the chart below (blue line).
This is only a toy example, of course, but the results imply that we should be cautious in assigning skill as a key factor for the results of the benchmark portfolio. Dumb luck seems to have played a role too.
But let’s not beat ourselves up too much. We can almost certainly avoid the fate of the worst performer among the random strategies by holding a broad set of asset classes. The probability is quite low that everything will fail at the same time, although the events of 2008 pushed that notion to the limit and left more than a few investors with doubts.
In any case, the main takeaway is that randomness in market behavior is a factor, and perhaps a dominant one, when it comes to risk and return in the context of portfolio design. That doesn’t mean we should throw up our hands and assume that we have no control over investment outcomes. Rather, the lesson is that a fair amount of what appears to be skill may be something else. In other words, our wetware has a tendency to be confused by randomness–a confusion that we’re all too often eager to facilitate, perhaps unconsciously.
Chance can’t be engineered out of the investing process, at least not entirely, but that’s only a minor issue if we’re prepared to deal with this gremlin. The intelligent response is to understand how randomness can influence risk and return and factor that aspect of market behavior into asset allocation analysis and design. Yes, many are fooled by randomness, but that doesn’t have to be every investor’s fate.
* * *
Previous articles in this series:
Portfolio Analysis in R: Part I | A 60/40 US Stock/Bond Portfolio
Portfolio Analysis in R: Part II | Analyzing A 60/40 Strategy
Portfolio Analysis in R: Part III | Adding A Global Strategy
Portfolio Analysis in R: Part IV | Enhancing A Global Strategy
Portfolio Analysis in R: Part V | Risk Analysis Via Factors
Portfolio Analysis in R: Part VI | Risk-Contribution Analysis
Tail-Risk Analysis In R: Part I
Managing Portfolio Risk With Tactical Asset Allocation
Tactical Asset Allocation For The Real World
We’re All Backtesters Now
Backtesting With Synthetic and Resampled Market Histories
3 Common Backtesting Traps With Easy Solutions
Using Random Portfolios To Test Asset Allocation Strategies
Skewed By Randomness: Testing Arbitrary Rebalancing Dates
Does Smart Beta = Smart Asset Allocation?
Modeling “Safe” Spending Rates For Retirement Portfolios
Estimating Return-Shortfall Risk For Portfolios
The Dynamic Duo Of Risk Factors: Part I
The Dynamic Duo Of Risk Factors: Part II


Pingback: Asset Pricing - TradingGods.net
Nice work in these posts. BTW, we use R for portfolio modeling and performance analysis here at ASRS.
Pingback: Quantocracy's Daily Wrap for 04/07/2016 | Quantocracy